This statistic reveals the number of people who were injured due to incidents of terrorism in the UK from 2010 to 2015. The data shows that there has been at least two injuries resulting from terrorism-related behavior annually, the peak was in 2013 with 64 individuals wounded.
Incidences of terrorism injuries in the United Kingdom (UK) from 2010 to 2015
Basic Account
Get to know the platform
You only have access to basic statistics.
This statistic is not included in your account.
Starter Account
The ideal entry-level account for individual users
- Instant access to 1m statistics
- Download in XLS, PDF & PNG format
- Detailed references
$199 USD / Month *
Professional Account
Full access
Business Solutions including all features.
* Prices do not include sales tax.
Other statistics that may interest you Terrorism in the United Kingdom
Overview
8
- Basic Statistic Terrorist attacks in 2022, by country
- Basic Statistic Worst terrorist acts - insured property losses 1970-2021
- Basic Statistic Worst terrorist attacks in Europe 1980-2022
- Basic Statistic Number of terrorist attacks in the UK 1970-2021
- Premium Statistic United Kingdom (UK): most dangerous terrorist groups from 1969-2009
- Premium Statistic United Kingdom (UK) terrorist attacks 1969-2009, by weapon type
- Premium Statistic United Kingdom (UK): incidences of terrorism 1994-2014, by target
- Premium Statistic United Kingdom (UK): incidences of terrorism 2010-2014, by target
Casualties and fatalities
7
- Basic Statistic The 20 worst terrorist attacks of 2013, by fatalities and injuries
- Premium Statistic Number of terrorist incidents worldwide from 2000 to 2013, by number of deaths
- Basic Statistic Countries with the highest share of deaths by terrorism 2022
- Premium Statistic Terrorist attack injuries in the United Kingdom 1990-2009
- Premium Statistic United Kingdom (UK): deaths from terrorism 1970-2009
- Premium Statistic 
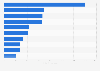
Injuries from terrorist incidents in United Kingdom (UK) 2010-2015
- Premium Statistic Number of fatalities from terrorism in the United Kingdom (UK) 2011-2015
Terror prevention
5
- Premium Statistic Terrorism-related arrests and charges in the United Kingdom (UK) 2001-2012
- Premium Statistic Terrorism-related arrests and charges in the UK 2001-2012, by religion
- Premium Statistic Number of arrests for terrorism-related offences in the UK 2002-2019, by age
- Basic Statistic Number of police stop and searches in England and Wales 2023, by police force
- Basic Statistic Number of arrests from stop and search England and Wales 2001-2023
Perception of terrorism
8
- Premium Statistic Perceptions on the possibility of a terrorist attack in the United Kingdom (UK) 2016
- Premium Statistic Perception of Muslim communities response to the threat of extremism UK 2016
- Premium Statistic UK/EU referendum opinion: potential change to threat of terrorism 2016
- Premium Statistic Public perception of terrorist attacks in the United Kingdom (UK) as of 2015, by age
- Basic Statistic Jewish safety concerns after Paris terrorist attacks United Kingdom (UK) 2015 survey
- Basic Statistic Jews considering leaving United Kingdom (UK) due to Paris terrorist attacks 2015
- Basic Statistic Fear of going out in city and town centers in Great Britain 2015
- Basic Statistic Fear of terrorist attacks in Great Britain 2015
Further related statistics
18
- Number and costs of U.S. work-related fatal and nonfatal injuries and illnesses 2011
- Costs of U.S. work-related injuries and illnesses by type 2011
- Rate of non-occupational fireworks-related injuries treated in the U.S. 2007-2022
- Share of non-occupational fireworks-related injuries treated U.S. 2022, by device
- Rate of injury for direct care workers in the U.S. in 2016, by worker type
- Share of non-occupational fireworks-related injuries treated U.S. 2022, by age
- Mortality rates by cause in selected countries worldwide 2012
- Rate of most common injuries among direct care workers U.S. 2016, by worker type
- Opinion on the risk of injury in selected sports in the U.S. 2023
- Serious aircraft cabin injuries worldwide by type 2018
- Average yearly expenses of having spinal cord injuries in the U.S. 2023
- Mortality rates by cause worldwide by income group 2012
- Share of people injured in road accidents India 2018, by vehicle age
- Share of non-occupational fireworks-related injuries treated U.S. 2022, by gender
- Average days lost per work-related injury in Great Britain 2009-2020
- Share of non-occupational fireworks-related injuries treated U.S. 2022, by injury
- Number of non-occupational fireworks-related injuries treated in the U.S. 2007-2022
- Occupational accidents with burns and scalds resulting in sick leave in Spain 2019
Further Content: You might find this interesting as well
Statistics
- Number and costs of U.S. work-related fatal and nonfatal injuries and illnesses 2011
- Costs of U.S. work-related injuries and illnesses by type 2011
- Rate of non-occupational fireworks-related injuries treated in the U.S. 2007-2022
- Share of non-occupational fireworks-related injuries treated U.S. 2022, by device
- Rate of injury for direct care workers in the U.S. in 2016, by worker type
- Share of non-occupational fireworks-related injuries treated U.S. 2022, by age
- Mortality rates by cause in selected countries worldwide 2012
- Rate of most common injuries among direct care workers U.S. 2016, by worker type
- Opinion on the risk of injury in selected sports in the U.S. 2023
- Serious aircraft cabin injuries worldwide by type 2018
- Average yearly expenses of having spinal cord injuries in the U.S. 2023
- Mortality rates by cause worldwide by income group 2012
- Share of people injured in road accidents India 2018, by vehicle age
- Share of non-occupational fireworks-related injuries treated U.S. 2022, by gender
- Average days lost per work-related injury in Great Britain 2009-2020
- Share of non-occupational fireworks-related injuries treated U.S. 2022, by injury
- Number of non-occupational fireworks-related injuries treated in the U.S. 2007-2022
- Occupational accidents with burns and scalds resulting in sick leave in Spain 2019
National Consortium for the Study of Terrorism and Responses to Terrorism. (June 1, 2016). Incidences of terrorism injuries in the United Kingdom (UK) from 2010 to 2015 [Graph]. In Statista. Retrieved May 04, 2024, from https://www.statista.com/statistics/540159/injuries-of-terrorism-uk/
National Consortium for the Study of Terrorism and Responses to Terrorism. "Incidences of terrorism injuries in the United Kingdom (UK) from 2010 to 2015." Chart. June 1, 2016. Statista. Accessed May 04, 2024. https://www.statista.com/statistics/540159/injuries-of-terrorism-uk/
National Consortium for the Study of Terrorism and Responses to Terrorism. (2016). Incidences of terrorism injuries in the United Kingdom (UK) from 2010 to 2015. Statista. Statista Inc.. Accessed: May 04, 2024. https://www.statista.com/statistics/540159/injuries-of-terrorism-uk/
National Consortium for the Study of Terrorism and Responses to Terrorism. "Incidences of Terrorism Injuries in The United Kingdom (Uk) from 2010 to 2015." Statista, Statista Inc., 1 Jun 2016, https://www.statista.com/statistics/540159/injuries-of-terrorism-uk/
National Consortium for the Study of Terrorism and Responses to Terrorism, Incidences of terrorism injuries in the United Kingdom (UK) from 2010 to 2015 Statista, https://www.statista.com/statistics/540159/injuries-of-terrorism-uk/ (last visited May 04, 2024)
Incidences of terrorism injuries in the United Kingdom (UK) from 2010 to 2015 [Graph], National Consortium for the Study of Terrorism and Responses to Terrorism, June 1, 2016. [Online]. Available: https://www.statista.com/statistics/540159/injuries-of-terrorism-uk/