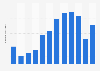
This statistic illustrates the number of business centers in France between 2010 and 2016. There were approximately 290 business centers in France in 2016, roughly 90 centers more than in 2010.
Number of business centers in France between 2010 and 2016
Basic Account
Get to know the platform
You only have access to basic statistics.
This statistic is not included in your account.
Starter Account
The ideal entry-level account for individual users
- Instant access to 1m statistics
- Download in XLS, PDF & PNG format
- Detailed references
$199 USD / Month *
Professional Account
Full access
Business Solutions including all features.
* Prices do not include sales tax.
Other statistics that may interest you Statistics on
About the industry
10
- Premium Statistic Standard workspaces outside main office worldwide 2018
- Basic Statistic Flexible office space in Dallas/ Ft. Worth 2010-2018
- Basic Statistic Flexible office space in San Francisco 2010-2018
- Basic Statistic Flexible office space in Denver 2010-2018
- Basic Statistic Flexible office space in Washington, D.C. 2010-2018
- Basic Statistic Flexible office space in Atlanta 2010-2018
- Basic Statistic Flexible office space in Seattle 2010-2018
- Premium Statistic Flexible office space in Manhattan 2010-2018
- Basic Statistic Flexible office space in Miami 2010-2018
- Basic Statistic Flexible office space in Los Angeles 2010-2018
About the region
9
- Premium Statistic Prime yield for office real estate in Europe 2022-2023, by city
- Premium Statistic Average price per square meter for office space in Italy 2019-2022, by macro-region
- Premium Statistic Italy: average price per square meter for office space 2022, by region
- Premium Statistic Businesses with a flexible workspace policy Europe 2019
- Premium Statistic Office real estate stock in Europe 2023, by city
- Premium Statistic Vacancy rate of office real estate in Europe 2021-2023, by city
- Premium Statistic Prime rent of office real estate in Europe 2022-2023, by city
- Premium Statistic Take-up of office space in Europe 2022-2023, by city
- Basic Statistic Investment and development prospects in office properties in Europe 2024
Other regions
10
- Premium Statistic Forecast office space pipeline supply Metro Manila Philippines 2021-2025
- Premium Statistic Cumulative number of coworking space openings South Korea 2009-2018
- Premium Statistic Flexible workspace - importance of future innovations to end users worldwide 2018
- Premium Statistic Flexible office operator growth APAC 2019 by operator
- Premium Statistic Co-working space operators in Ho Chi Minh City Vietnam 2018 by number of centers
- Basic Statistic Flexible office space in Chicago 2012-2018
- Premium Statistic Office space of global company branches in India 2020, by region
- Premium Statistic Office properties: vacancy rates in Nordic countries H2 2016
- Premium Statistic Shared office space area in China 2012-2019
- Premium Statistic Office vacancy rate in the emirate of Abu Dhabi 2012-2017
Related statistics
10
- Basic Statistic Flexible office space in Boston 2010-2018
- Premium Statistic Flexible workspace - meeting of short- and long-term real estate needs worldwide 2018
- Premium Statistic Top flexible office space operators in Denver as of Q2 2019
- Basic Statistic Flexible office space in St. Louis 2010-2018
- Premium Statistic Top flexible office space operators in Phoenix as of Q2 2019
- Basic Statistic Flexible office space in Sacramento 2010-2018
- Premium Statistic Top flexible office space operators in Pittsburgh Q2 2019
- Basic Statistic Flexible office space in Orange County 2010-2018
- Premium Statistic Top flexible office space operators in Washington, D.C as of Q2 2019
- Basic Statistic Flexible office space in Charlotte 2010-2018
Further Content: You might find this interesting as well
Zevillage, & Neo-nomade. (July 12, 2017). Number of business centers in France between 2010 and 2016 [Graph]. In Statista. Retrieved May 11, 2024, from https://www.statista.com/statistics/745915/business-centers-france/
Zevillage, und Neo-nomade. "Number of business centers in France between 2010 and 2016." Chart. July 12, 2017. Statista. Accessed May 11, 2024. https://www.statista.com/statistics/745915/business-centers-france/
Zevillage, Neo-nomade. (2017). Number of business centers in France between 2010 and 2016. Statista. Statista Inc.. Accessed: May 11, 2024. https://www.statista.com/statistics/745915/business-centers-france/
Zevillage, and Neo-nomade. "Number of Business Centers in France between 2010 and 2016." Statista, Statista Inc., 12 Jul 2017, https://www.statista.com/statistics/745915/business-centers-france/
Zevillage & Neo-nomade, Number of business centers in France between 2010 and 2016 Statista, https://www.statista.com/statistics/745915/business-centers-france/ (last visited May 11, 2024)
Number of business centers in France between 2010 and 2016 [Graph], Zevillage, & Neo-nomade, July 12, 2017. [Online]. Available: https://www.statista.com/statistics/745915/business-centers-france/