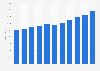
This statistic illustrates the purchasing power of households in Italy from the fourth quarter of 2017 to the first quarter of 2021. According to data, in the first quarter of 2019 the purchasing power of the Italian households reached 277,638 million euros.
Purchasing power of households in Italy from the 1st quarter of 2017 to the 1st quarter of 2021 (in million euros)
Basic Account
Get to know the platform
You only have access to basic statistics.
This statistic is not included in your account.
Starter Account
The ideal entry-level account for individual users
- Instant access to 1m statistics
- Download in XLS, PDF & PNG format
- Detailed references
$199 USD / Month *
Professional Account
Full access
Business Solutions including all features.
* Prices do not include sales tax.
Further Content: You might find this interesting as well
Statistics
- Share of households with increasing purchasing power in the Netherlands 2014-2019
- Median household income after tax in Norway 2022, by type of household
- Share of total household income from wages and salaries UK 2017/18 by ethnicity
- Share of total household income from wages and salaries UK 2017/18, by age
- Sources of total gross household income United Kingdom (UK) 2017/18
- Number of cost burdened households among owners in the U.S. 2017, by income
- Share of total household income from earnings England, by region 2017/18
- Number of households in New York City, New York by household income 2020
- Share of total household income from state support England 2017/18, by region
- Number of households in Nashville, Tennessee metro area by household income 2021
- Share of total gross household income from earnings UK 2004-2018
- Distribution of weekly gross incomes in households with children UK 2017/18
- Number of cost burdened households among renters in the U.S. 2021, by income
- Share of total household income from wages and salaries UK 2017/18, by country
- Distribution of total weekly household incomes in Northern Ireland 2017/18
- U.S. Oregon median household income 1990-2022
- Percentage change in purchasing power in Italy 2020-2023
Istat. (July 1, 2021). Purchasing power of households in Italy from the 1st quarter of 2017 to the 1st quarter of 2021 (in million euros) [Graph]. In Statista. Retrieved May 11, 2024, from https://www.statista.com/statistics/677797/purchasing-power-of-households-italy/
Istat. "Purchasing power of households in Italy from the 1st quarter of 2017 to the 1st quarter of 2021 (in million euros)." Chart. July 1, 2021. Statista. Accessed May 11, 2024. https://www.statista.com/statistics/677797/purchasing-power-of-households-italy/
Istat. (2021). Purchasing power of households in Italy from the 1st quarter of 2017 to the 1st quarter of 2021 (in million euros). Statista. Statista Inc.. Accessed: May 11, 2024. https://www.statista.com/statistics/677797/purchasing-power-of-households-italy/
Istat. "Purchasing Power of Households in Italy from The 1st Quarter of 2017 to The 1st Quarter of 2021 (in Million Euros)." Statista, Statista Inc., 1 Jul 2021, https://www.statista.com/statistics/677797/purchasing-power-of-households-italy/
Istat, Purchasing power of households in Italy from the 1st quarter of 2017 to the 1st quarter of 2021 (in million euros) Statista, https://www.statista.com/statistics/677797/purchasing-power-of-households-italy/ (last visited May 11, 2024)
Purchasing power of households in Italy from the 1st quarter of 2017 to the 1st quarter of 2021 (in million euros) [Graph], Istat, July 1, 2021. [Online]. Available: https://www.statista.com/statistics/677797/purchasing-power-of-households-italy/