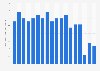
Change in foodservice/restaurant visits in the United Kingdom (UK) Q4 2015-Q2 2018

Change in foodservice market visits in the United Kingdom (UK) from 4th quarter 2015 to 2nd quarter 2018

Download
Show detailed source information?
Register for free
Already a member?
Log in
Source

Use Ask Statista Research Service

Release date

August 2018

Region

United Kingdom

Survey time period

Q4 2015 to Q2 2018

Supplementary notes

Change compared to previous year.
The data cover the total out-of-home foodservice market (including full service and quick service restaurants).

Citation formats
Statista Accounts: Access All Statistics. Starting from $2,388 USD / Year
Basic Account
Get to know the platform

You only have access to basic statistics.
This statistic is not included in your account.

Starter Account
The ideal entry-level account for individual users
  • Instant access to 1m statistics
  • Download in XLS, PDF & PNG format
  • Detailed references
$199 USD / Month *
Professional Account
Full access

Business Solutions including all features.

* Prices do not include sales tax.

Statistics on " Eating out in the United Kingdom (UK) "

Other statistics that may interest you Eating out in the United Kingdom (UK)

Market overview

5

Food service brands

5

Spending

8

Eating out behavior

8

Out of home food consumption

7

Further related statistics

18
Statista Accounts: Access All Statistics. Starting from $2,388 USD / Year
Learn more about how Statista can support your business.