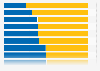
This statistic shows the British public's view on the perceived likelihood of the GBP 350 million weekly contribution to the EU actually being saved and spent in Britain after leaving the EU. During the survey period it was found that 84 percent of respondents who voted for the UK to remain within the EU predict that this won't occur, 31 percent of respondents who voted for the "Brexit" agree with them.
Do you think the £350m weekly contribution to the EU will be saved and spent in Britain by leaving the EU?
Basic Account
Get to know the platform
You only have access to basic statistics.
This statistic is not included in your account.
Starter Account
The ideal entry-level account for individual users
- Instant access to 1m statistics
- Download in XLS, PDF & PNG format
- Detailed references
$199 USD / Month *
Professional Account
Full access
Business Solutions including all features.
* Prices do not include sales tax.
Other statistics that may interest you Statistics on
About the industry
10
- Premium Statistic British public's opinion on a second EU referendum, by voting choice on June 23
- Premium Statistic Conservative Party Members' opinion of David Cameron's leadership by referendum vote
- Premium Statistic Labour party members' EU referendum voting intention in the United Kingdom in 2016
- Premium Statistic Conservative Party Members' opinion of David Cameron's resignation by referendum vote
- Premium Statistic Distribution of General Election votes in the UK in 2017, by age group
- Basic Statistic Brexit votes by region in the UK 2016
- Premium Statistic Public opinion on immigration into the UK post-Brexit 2016
- Premium Statistic Public opinion on crime rates in the UK post-Brexit, by Brexit vote
- Basic Statistic Voter turnout of national parliamentary elections in Sweden 1970-2022
- Basic Statistic Voter turnout of national parliamentary elections in Norway 1945-2021
About the region
10
- Premium Statistic Distribution of British voters who changed decision post referendum in 2016
- Basic Statistic Brexit votes in the UK by education 2016
- Premium Statistic Perceived likelihood of voting in the EU referendum in the Great Britain 2015
- Basic Statistic Opinion on EU market access for the United Kingdom (UK) post-Brexit in 2016
- Premium Statistic Survey on possible negative consequences of Brexit in the United Kingdom (UK) in 2016
- Premium Statistic Survey on possible positive consequences of Brexit in the United Kingdom (UK) 2016
- Premium Statistic Distribution of voting methods in EU referendum in GB, by gender 2016
- Premium Statistic EU referendum voting intention in Great Britain (GB) 2016, by age and gender
- Premium Statistic Asian voter distribution in the UK 2015 election
- Basic Statistic UK general election 2015 voting intention May 6 2015
Other regions
10
- Premium Statistic 2016 EU referendum: number of votes for “Remain” and “Leave”, by region
- Basic Statistic Brazil: share of voters for the independence of southern states 2016-2017
- Basic Statistic United States presidential election 1860: electoral college results
- Premium Statistic Voter turnout for presidential election in Egypt 2005-2018
- Premium Statistic Italy: voters turnout of national elections on March 4, 2018, by section
- Basic Statistic Survey on voting in general elections in Sweden 2016, by gender
- Basic Statistic Scotland voting intention in a UK general election 2018-2024
- Basic Statistic Number of votes in the Norwegian parliamentary election 2017, by party
- Basic Statistic 2014 European elections: voting intention by political party
- Premium Statistic Voter preference for presidential candidates for 2017 election in Iran 2016
Related statistics
10
- Premium Statistic Brexit referendum turnout in the UK 2016
- Premium Statistic United Kingdom (UK): number of valid votes from the EU referendum 2016, by region
- Premium Statistic Number of rejected ballots from the EU referendum 2016, by UK region
- Premium Statistic Number of eligible voters in the EU referendum 2016, by UK region
- Premium Statistic Perceived increase of fascism in the United Kingdom (UK) 2017, by gender
- Premium Statistic UK: number of counted ballot papers from the EU referendum 2016, by region
- Premium Statistic United Kingdom survey: Increase of fascism in the United States in 2017
- Premium Statistic Perceived increase of fascism in Europe, in the United Kingdom (UK) in 2017
- Basic Statistic Brexit votes in the UK by social grade 2016
- Basic Statistic Number of seats won in Scottish Parliamentary elections 1999-2021
Further related statistics
5
- Finance director salary per annum in Dublin (Ireland) 2018, by company size
- U.S. high school students' concerns about paying for college 2016
- Favorability ratings of NATO, by country 2012
- Opinions on increasing family life trends in the United States in 2010
- Opinions on gay/lesbian couples raising children in the United States as of 2010, by age
Further Content: You might find this interesting as well
Statistics
- Finance director salary per annum in Dublin (Ireland) 2018, by company size
- U.S. high school students' concerns about paying for college 2016
- Favorability ratings of NATO, by country 2012
- Opinions on increasing family life trends in the United States in 2010
- Opinions on gay/lesbian couples raising children in the United States as of 2010, by age
YouGov. (June 29, 2016). Do you think the £350m weekly contribution to the EU will be saved and spent in Britain by leaving the EU? [Graph]. In Statista. Retrieved April 23, 2024, from https://www.statista.com/statistics/569206/perceived-likelihood-of-eu-contribution-to-be-spent-in-uk/
YouGov. "Do you think the £350m weekly contribution to the EU will be saved and spent in Britain by leaving the EU? ." Chart. June 29, 2016. Statista. Accessed April 23, 2024. https://www.statista.com/statistics/569206/perceived-likelihood-of-eu-contribution-to-be-spent-in-uk/
YouGov. (2016). Do you think the £350m weekly contribution to the EU will be saved and spent in Britain by leaving the EU? . Statista. Statista Inc.. Accessed: April 23, 2024. https://www.statista.com/statistics/569206/perceived-likelihood-of-eu-contribution-to-be-spent-in-uk/
YouGov. "Do You Think The £350m Weekly Contribution to The Eu Will Be Saved and Spent in Britain by Leaving The Eu? ." Statista, Statista Inc., 29 Jun 2016, https://www.statista.com/statistics/569206/perceived-likelihood-of-eu-contribution-to-be-spent-in-uk/
YouGov, Do you think the £350m weekly contribution to the EU will be saved and spent in Britain by leaving the EU? Statista, https://www.statista.com/statistics/569206/perceived-likelihood-of-eu-contribution-to-be-spent-in-uk/ (last visited April 23, 2024)
Do you think the £350m weekly contribution to the EU will be saved and spent in Britain by leaving the EU? [Graph], YouGov, June 29, 2016. [Online]. Available: https://www.statista.com/statistics/569206/perceived-likelihood-of-eu-contribution-to-be-spent-in-uk/