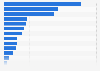
Quarterly business travel spending from Italy in the UK in 2015, by gender
This statistic presents quarterly business travel spending from Italy in the United Kingdom (UK) in 2015, by gender. Female travelers spent 26.3 million British pounds in the second quarter of that year, compared to 3.2 million British pounds in the following quarter.