In the Brexit referendum that took place on June 23, 206, approximately 57 percent of people in upper middle-class professions voted to Remain compared with 43 percent who voted to Leave. Among those in lower-working class professions, 64 percent voted to leave, and 36 percent to Remain.
Share of votes in the Brexit referendum of 2016 in the United Kingdom, by social grade
Loading statistic...
Basic Account
Get to know the platform
You only have access to basic statistics.
Starter Account
The ideal entry-level account for individual users
- Instant access to 1m statistics
- Download in XLS, PDF & PNG format
- Detailed references
$199 USD / Month *
Professional Account
Full access
Business Solutions including all features.
* Prices do not include sales tax.
Other statistics that may interest you Brexit referendum 2016
Overview
5
- Basic Statistic Result of the Brexit referendum 2016, by percentage of votes
- Basic Statistic Result of the Brexit referendum 2016, by number of votes cast
- Premium Statistic Brexit results by nation in the UK 2016
- Premium Statistic Brexit referendum turnout in the UK 2016
- Basic Statistic Results of the EEC membership referendum of 1975 in the UK
Voter breakdown
8
- Basic Statistic Brexit votes in the United Kingdom by gender 2016
- Basic Statistic Brexit votes in the UK by age 2016
- Basic Statistic Brexit votes in the UK by ethnicity 2016
- Basic Statistic Brexit votes in the UK by education 2016
- Basic Statistic 
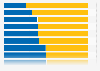
Brexit votes in the UK by social grade 2016
- Basic Statistic Brexit votes by region in the UK 2016
- Basic Statistic Brexit referendum results in major cities of the UK 2016
- Premium Statistic Leading areas that voted to remain in the Brexit referendum 2016
Brexit issues
5
- Basic Statistic Net migration in the UK 1991-2023, by citizenship
- Basic Statistic UK transactions with the EU 1973-2019
- Basic Statistic Number of EU nationals in the United Kingdom 2019-2020
- Basic Statistic Number of UK citizens living in EU countries 2019
- Premium Statistic Most important issue for British voters in the EU referendum in June 2016
Brexit negotiations
6
- Basic Statistic Results of key votes on Brexit in the UK House of Commons 2019-2020
- Basic Statistic Net satisfaction scores for the Prime Minister and Opposition in the UK 2016-2019
- Basic Statistic Support for no-deal Brexit or different Brexit scenarios in 2019
- Basic Statistic How UK members of parliament voted on Theresa May's Brexit Deal in 2019
- Basic Statistic How UK members of parliament voted on Theresa May's second Brexit deal in 2019
- Basic Statistic How UK members of parliament voted on Theresa May's third Brexit deal in 2019
Further related statistics
19
- Pro-Brexit attitudes on rising grocery prices in the UK post-Brexit 2016, by age
- Pro-Brexit attitudes on financial industry moving to EU post-Brexit 2016, by region
- Pro-Brexit attitudes on the finance industry moving abroad post-Brexit 2016
- Public opinion on immigration into the UK post-Brexit 2016
- Public opinion on crime rates in the UK post-Brexit, by Brexit vote
- Public opinion on the development of governance post-Brexit 2016, by referendum vote
- Pro-Brexit attitudes on Scotland leaving the UK post-Brexit 2016, by age
- Scottish public opinion on Scotland remaining in the EU and the UK after Brexit, 2016
- Scottish public opinion on Scotland remaining in the EU after Brexit, 2016
- Opinion on proroguing Parliament to force a no-deal Brexit in Great Britain 2019
- UK confidence of negotiating fairer immigration system post-Brexit
- Reasons for voting leave in the EU referendum in United Kingdom (UK) on June 23, 2016
- Italy: opinion on European Union membership 2017
- European citizens' voting intentions on their country's EU Membership in 2018
- Opinion on the suspension of extraction at the Turów lignite mine in Poland 2021
- Worst treated class by government in Great Britain 2017
- Perception of socio-economic status in Spain 2023
- Costa Rica: social mobility index by area 2020
- Argentina: social mobility index by area 2020
Further Content: You might find this interesting as well
Statistics
- Pro-Brexit attitudes on rising grocery prices in the UK post-Brexit 2016, by age
- Pro-Brexit attitudes on financial industry moving to EU post-Brexit 2016, by region
- Pro-Brexit attitudes on the finance industry moving abroad post-Brexit 2016
- Public opinion on immigration into the UK post-Brexit 2016
- Public opinion on crime rates in the UK post-Brexit, by Brexit vote
- Public opinion on the development of governance post-Brexit 2016, by referendum vote
- Pro-Brexit attitudes on Scotland leaving the UK post-Brexit 2016, by age
- Scottish public opinion on Scotland remaining in the EU and the UK after Brexit, 2016
- Scottish public opinion on Scotland remaining in the EU after Brexit, 2016
- Opinion on proroguing Parliament to force a no-deal Brexit in Great Britain 2019
- UK confidence of negotiating fairer immigration system post-Brexit
- Reasons for voting leave in the EU referendum in United Kingdom (UK) on June 23, 2016
- Italy: opinion on European Union membership 2017
- European citizens' voting intentions on their country's EU Membership in 2018
- Opinion on the suspension of extraction at the Turów lignite mine in Poland 2021
- Worst treated class by government in Great Britain 2017
- Perception of socio-economic status in Spain 2023
- Costa Rica: social mobility index by area 2020
- Argentina: social mobility index by area 2020
Lord Ashcroft Polls. (June 24, 2016). Share of votes in the Brexit referendum of 2016 in the United Kingdom, by social grade [Graph]. In Statista. Retrieved April 23, 2024, from https://www.statista.com/statistics/518395/brexit-votes-by-social-class/
Lord Ashcroft Polls. "Share of votes in the Brexit referendum of 2016 in the United Kingdom, by social grade ." Chart. June 24, 2016. Statista. Accessed April 23, 2024. https://www.statista.com/statistics/518395/brexit-votes-by-social-class/
Lord Ashcroft Polls. (2016). Share of votes in the Brexit referendum of 2016 in the United Kingdom, by social grade . Statista. Statista Inc.. Accessed: April 23, 2024. https://www.statista.com/statistics/518395/brexit-votes-by-social-class/
Lord Ashcroft Polls. "Share of Votes in The Brexit Referendum of 2016 in The United Kingdom, by Social Grade ." Statista, Statista Inc., 24 Jun 2016, https://www.statista.com/statistics/518395/brexit-votes-by-social-class/
Lord Ashcroft Polls, Share of votes in the Brexit referendum of 2016 in the United Kingdom, by social grade Statista, https://www.statista.com/statistics/518395/brexit-votes-by-social-class/ (last visited April 23, 2024)
Share of votes in the Brexit referendum of 2016 in the United Kingdom, by social grade [Graph], Lord Ashcroft Polls, June 24, 2016. [Online]. Available: https://www.statista.com/statistics/518395/brexit-votes-by-social-class/