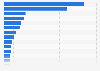
This statistic illustrates the trend in the retail sales volume of specialized stores for cultural and recreational goods in Sweden from 2008 to 2018. Despite some fluctuation, sales volume in cultural and recreational stores have gradually risen. In 2018, the index was measured at 107.3, with 2015 as base year.
Sales volume of specialized stores for cultural and recreational goods in Sweden from 2008 to 2018 (as index at current prices)
Basic Account
Get to know the platform
You only have access to basic statistics.
This statistic is not included in your account.
Starter Account
The ideal entry-level account for individual users
- Instant access to 1m statistics
- Download in XLS, PDF & PNG format
- Detailed references
$199 USD / Month *
Professional Account
Full access
Business Solutions including all features.
* Prices do not include sales tax.
Other statistics that may interest you Statistics on
About the industry
10
- Premium Statistic Sports and recreation stores: retail sales growth in the Netherlands 2005-2022
- Basic Statistic Sporting goods, hobby, book, and music per capita spending U.S. 2000-2022
- Premium Statistic Retail sales turnover index of recreational goods stores in the Netherlands 2007-2023
- Premium Statistic Leading hobby and craft retailers in the U.S. in 2019, based on sales per store
- Premium Statistic Hobby, toy, and game store sales in the U.S. 1992-2022
- Basic Statistic Number of game and toy retail stores in the UK 2023, by turnover
- Premium Statistic Book market volume in Russia 2021, by sales channel
- Premium Statistic Number of stores of the leading hobby and craft retailers in the U.S. in 2018
- Premium Statistic Sports retailers market share in Norway 2018
- Premium Statistic Number of games and toy retail stores in the UK 2023, by employees
About the region
10
- Premium Statistic Non-specialized food stores: retail sales volume trend in Sweden 2008-2018
- Premium Statistic Monthly clothing and footwear retail sales volume trend in Sweden 2020-2022
- Premium Statistic Retail sales turnover of alcoholic beverages in Sweden 2009-2020
- Premium Statistic Retail sales turnover of confectionery and sweet spreads in Sweden 2009-2022
- Premium Statistic Retail sales turnover of fruit in Sweden 2009-2022
- Premium Statistic Retail sales turnover of vegetables in Sweden 2009-2022
- Premium Statistic Retail sales turnover of beer in Sweden 2009-2020
- Premium Statistic Retail sales turnover of wine in Sweden 2009-2020
- Premium Statistic Food sales turnover in Sweden 2008-2022
- Premium Statistic Sales turnover of bread and cereals in Sweden 2008-2022
Other regions
10
- Premium Statistic Non-food retail store monthly sales volume growth in Great Britain 2016-2023
- Basic Statistic United States: furniture and home furnishings sales per capita 2000-2022
- Premium Statistic Japan: retail sales of functional energy drinks 2010-2020
- Premium Statistic Retail trade sales growth in Spain 2004-2020
- Premium Statistic Retail trade sales growth in Greece 2004-2019
- Premium Statistic Revenue from retail sales in sporting equipment stores in Czechia 2010-2017
- Basic Statistic Volume of retail trade monthly in the European Union 2017-2018 (as index)
- Premium Statistic Retail trade sales growth in Iceland 2007-2017
- Premium Statistic Sales volume of baked goods in Canada 2016/2021
- Premium Statistic Retail sales value in North America 2014-2018
Related statistics
10
- Basic Statistic Estimated U.S. per capita retail spending from 2000 to 2022
- Basic Statistic Estimated U.S. motor vehicle and parts dealer per capita spending 2000-2022
- Basic Statistic Estimated U.S. per capita retail spending 2004-2022, by segment
- Basic Statistic Sports, games and toys: retail sales volume index monthly in Great Britain 2016-2022
- Basic Statistic Turnover volume index of non-food retail shops in the Netherlands 2009-2023
- Basic Statistic Turnover volume index of shops selling DIY articles in the Netherlands 2009-2023
- Premium Statistic Retail trade sales growth in Ireland 2004-2022
- Premium Statistic Games, toys and sports equipment: Sales volume index in Great Britain (UK) 2011-2022
- Premium Statistic Sporting goods, hobby, music, and book store sales in the U.S. from 1992 to 2022
- Basic Statistic Sporting goods, hobby and musical instrument store sales in the U.S. 1992-2022
Further related statistics
9
- Electrical appliances retail sales volume index in Great Britain (UK) 2013-2023
- Number of Nike stores globally 2009-2023
- Forecast of retail sales growth in Western Europe 2008-2018
- Forecast of retail sales growth in Indonesia 2008-2018
- Forecast for Malaysia's retail sales 2008-2016
- Footwear retail sales volume trend in Great Britain (UK) 2008-2022
- John Lewis sales revenue in the United Kingdom (UK) 2009-2023
- Waitrose sales revenue in the United Kingdom (UK) 2009-2023
- Tesco's sales worldwide 2016/2017-2022/2023, by region
Further Content: You might find this interesting as well
Statistics
- Electrical appliances retail sales volume index in Great Britain (UK) 2013-2023
- Number of Nike stores globally 2009-2023
- Forecast of retail sales growth in Western Europe 2008-2018
- Forecast of retail sales growth in Indonesia 2008-2018
- Forecast for Malaysia's retail sales 2008-2016
- Footwear retail sales volume trend in Great Britain (UK) 2008-2022
- John Lewis sales revenue in the United Kingdom (UK) 2009-2023
- Waitrose sales revenue in the United Kingdom (UK) 2009-2023
- Tesco's sales worldwide 2016/2017-2022/2023, by region
Statistics Sweden. (March 28, 2019). Sales volume of specialized stores for cultural and recreational goods in Sweden from 2008 to 2018 (as index at current prices) [Graph]. In Statista. Retrieved May 08, 2024, from https://www.statista.com/statistics/446592/cultural-stores-retail-sales-volume-trend-sweden/
Statistics Sweden. "Sales volume of specialized stores for cultural and recreational goods in Sweden from 2008 to 2018 (as index at current prices)." Chart. March 28, 2019. Statista. Accessed May 08, 2024. https://www.statista.com/statistics/446592/cultural-stores-retail-sales-volume-trend-sweden/
Statistics Sweden. (2019). Sales volume of specialized stores for cultural and recreational goods in Sweden from 2008 to 2018 (as index at current prices). Statista. Statista Inc.. Accessed: May 08, 2024. https://www.statista.com/statistics/446592/cultural-stores-retail-sales-volume-trend-sweden/
Statistics Sweden. "Sales Volume of Specialized Stores for Cultural and Recreational Goods in Sweden from 2008 to 2018 (as Index at Current Prices)." Statista, Statista Inc., 28 Mar 2019, https://www.statista.com/statistics/446592/cultural-stores-retail-sales-volume-trend-sweden/
Statistics Sweden, Sales volume of specialized stores for cultural and recreational goods in Sweden from 2008 to 2018 (as index at current prices) Statista, https://www.statista.com/statistics/446592/cultural-stores-retail-sales-volume-trend-sweden/ (last visited May 08, 2024)
Sales volume of specialized stores for cultural and recreational goods in Sweden from 2008 to 2018 (as index at current prices) [Graph], Statistics Sweden, March 28, 2019. [Online]. Available: https://www.statista.com/statistics/446592/cultural-stores-retail-sales-volume-trend-sweden/