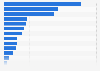
This statistic presents the total number of inbound visitors in the Netherlands from 2012 to 2018. The number of visitors increased from 12.2 million in 2012 to 18.8 million in 2018.
Number of inbound visitors in the Netherlands from 2012 to 2018 (in 1,000)
Basic Account
Get to know the platform
You only have access to basic statistics.
This statistic is not included in your account.
Starter Account
The ideal entry-level account for individual users
- Instant access to 1m statistics
- Download in XLS, PDF & PNG format
- Detailed references
$199 USD / Month *
Professional Account
Full access
Business Solutions including all features.
* Prices do not include sales tax.
Other statistics that may interest you Statistics on
About the industry
10
- Premium Statistic Number of inbound tourists in Greece 2005-2023
- Premium Statistic Inbound overnight tourist arrivals in Poland 2009-2021
- Premium Statistic Inbound same-day tourist arrivals in Poland 2009-2021
- Basic Statistic Inbound tourism: international arrivals in Poland 2009-2021
- Premium Statistic Number of inbound tourists in Malta 2001-2023
- Premium Statistic Overnight domestic tourism in Poland from 2012 to 2021
- Premium Statistic Number of domestic tourism nights in Luxembourg 2011-2020
- Premium Statistic Inbound overnight tourism in Portugal 2013-2018
- Premium Statistic Domestic overnight visitors in Switzerland 2012-2018
- Premium Statistic Inbound overnight tourist arrivals in Switzerland 2010-2018
About the region
10
- Premium Statistic Leading international travel markets to the Netherlands 2018
- Premium Statistic Inbound travel spending in the Netherlands 2012-2018
- Basic Statistic Hotel nights spent by international visitors in the Netherlands 2022, by city
- Basic Statistic International hotel guests in the Netherlands 2013-2022, by continent
- Basic Statistic Hotel nights spent by domestic visitors in the Netherlands 2022, by city
- Basic Statistic Hotel nights spent by domestic visitors in the Netherlands 2022, by region
- Basic Statistic International hotel guests in the Netherlands 2022, by region
- Basic Statistic Hotel nights by international visitors in the Netherlands 2022, by city and continent
- Basic Statistic Hotel nights by international visitors in the Netherlands 2013-2022, by continent
- Basic Statistic Quarterly inbound hotel nights in the Netherlands 2022, by region
Selected statistics
9
- Premium Statistic Countries with the highest number of inbound tourist arrivals worldwide 2019-2022
- Premium Statistic Countries with the highest outbound tourism expenditure worldwide 2019-2022
- Basic Statistic Number of international tourist arrivals in India 2010-2021
- Premium Statistic Leading countries in the MEA in the Travel & Tourism Competitiveness Index 2018
- Premium Statistic Change in number of visitors from Mexico to the U.S. 2018-2024
- Premium Statistic International tourist arrivals in Europe 2006-2023
- Premium Statistic Annual revenue of China Tourism Group Duty Free 2013-2023
- Basic Statistic Foreign exchange earnings from tourism in India 2000-2022
- Basic Statistic International tourism receipts of India 2011-2022
Other regions
10
- Basic Statistic International overnight tourist arrivals in Hungary 2009-2023
- Premium Statistic Number of domestic tourism trips in Latvia 2010-2022
- Premium Statistic Domestic tourism overnight trips in Russia 2010-2019
- Premium Statistic Overnight domestic tourism in Norway 2008-2018
- Premium Statistic Number of overnight stays on inbound visits to Sweden 2008-2018
- Premium Statistic Number of domestic trips in Slovakia 2012-2018
- Basic Statistic International tourist trips to Czechia 2008-2022
- Premium Statistic International visitors in Zanzibar 2015-2021
- Basic Statistic Number of monthly visits in Costa del Sol in Spain 2014-2015
- Premium Statistic Main international travel markets for Switzerland 2012-2018
Related statistics
10
- Premium Statistic Number of inbound tourist visits to Greece 2019-2022, by region
- Premium Statistic Number of international air arrivals in Crete, Greece 2010-2023
- Premium Statistic Number of tourist overnight stays in Venice 2003-2022
- Premium Statistic Number of international tourist arrivals in Venice 2011-2022
- Premium Statistic Number of domestic tourist arrivals in Venice 2012-2022
- Premium Statistic Leading inbound travel markets in Venice 2019-2022, by number of arrivals
- Premium Statistic Number of tourist arrivals in Venice 2003-2022
- Premium Statistic Number of international air arrivals in Crete 2019-2023, by month
- Premium Statistic Number of domestic air arrivals in Crete 2010-2023
- Premium Statistic Cyprus: tourist arrivals from Italy 2007-2019
Further related statistics
10
- Contribution of China's travel and tourism industry to GDP 2014-2023
- Number of international tourist arrivals APAC 2019, by country or region
- Growth of inbound spending in the U.S. using foreign visa credit cards
- Most visited amusement and theme parks in North America 2022
- Seaworld Florida theme park attendance 2009-2022
- Most visited amusement and theme parks APAC 2019-2021
- Seaworld California theme park attendance 2009-2022
- Most visited Latin American amusement and theme parks 2019-2022
- Busch Gardens Tampa Bay theme park attendance 2009-2022
- Walt Disney World Magic Kingdom theme park attendance 2009-2022
Further Content: You might find this interesting as well
Statistics
- Contribution of China's travel and tourism industry to GDP 2014-2023
- Number of international tourist arrivals APAC 2019, by country or region
- Growth of inbound spending in the U.S. using foreign visa credit cards
- Most visited amusement and theme parks in North America 2022
- Seaworld Florida theme park attendance 2009-2022
- Most visited amusement and theme parks APAC 2019-2021
- Seaworld California theme park attendance 2009-2022
- Most visited Latin American amusement and theme parks 2019-2022
- Busch Gardens Tampa Bay theme park attendance 2009-2022
- Walt Disney World Magic Kingdom theme park attendance 2009-2022
OECD. (March 4, 2020). Number of inbound visitors in the Netherlands from 2012 to 2018 (in 1,000) [Graph]. In Statista. Retrieved May 04, 2024, from https://www.statista.com/statistics/444725/number-of-inbound-visitors-in-the-netherlands/
OECD. "Number of inbound visitors in the Netherlands from 2012 to 2018 (in 1,000)." Chart. March 4, 2020. Statista. Accessed May 04, 2024. https://www.statista.com/statistics/444725/number-of-inbound-visitors-in-the-netherlands/
OECD. (2020). Number of inbound visitors in the Netherlands from 2012 to 2018 (in 1,000). Statista. Statista Inc.. Accessed: May 04, 2024. https://www.statista.com/statistics/444725/number-of-inbound-visitors-in-the-netherlands/
OECD. "Number of Inbound Visitors in The Netherlands from 2012 to 2018 (in 1,000)." Statista, Statista Inc., 4 Mar 2020, https://www.statista.com/statistics/444725/number-of-inbound-visitors-in-the-netherlands/
OECD, Number of inbound visitors in the Netherlands from 2012 to 2018 (in 1,000) Statista, https://www.statista.com/statistics/444725/number-of-inbound-visitors-in-the-netherlands/ (last visited May 04, 2024)
Number of inbound visitors in the Netherlands from 2012 to 2018 (in 1,000) [Graph], OECD, March 4, 2020. [Online]. Available: https://www.statista.com/statistics/444725/number-of-inbound-visitors-in-the-netherlands/