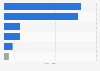
This statistic shows the revenue of oil and gas extraction support activities in South Africa from 2008 to 2012, with a projection until 2018. In 2010, revenues of oil and gas extraction support activities in South Africa amounted to approximately 4.41 billion U.S. dollars.
Revenue of oil and gas extraction support activities (SIC 09.10) in South Africa from 2008 to 2018 (in million U.S. dollars)
Other statistics that may interest you Statistics on
About the industry
10
- Premium Statistic Revenue of the extraction of crude petroleum & natural gas industry in Italy 2012-2027
- Premium Statistic Industry revenue of “activities for petroleum and natural gas extraction“ in Germany 2012-2025
- Premium Statistic Industry revenue of “activities for petroleum and natural gas extraction“ in Spain 2012-2025
- Premium Statistic Industry revenue of “activities for petroleum and natural gas extraction“ in the United Kingdom 2012-2025
- Premium Statistic Activities for petroleum and natural gas extraction revenue in Ireland 2010-2022
- Premium Statistic Activities for petroleum and natural gas extraction revenue in Bulgaria 2011-2022
- Basic Statistic Forecast: revenue oil and gas extraction support activities France 2009-2020
- Basic Statistic Crude oil production in the U.S. by state 2023
- Premium Statistic Production volume of crude oil and condensate in New Zealand 2012-2022
- Premium Statistic Largest global oil refineries by capacity 2023
About the region
10
- Premium Statistic Industry revenue of “mining of coal and lignite“ in South Africa 2011-2023
- Premium Statistic Total energy production from petroleum in South Africa 2005-2021
- Premium Statistic Total energy production in South Africa 2021, by source
- Premium Statistic Total energy consumption in South Africa 2021, by source
- Premium Statistic Breakdown of retail trade sales in South Africa 2022, by type of retailer
- Premium Statistic Annual FDI flows from China to South Africa 2012-2022
- Premium Statistic Total FDI stock from China in South Africa 2012-2022
- Premium Statistic Import value of South African food products to China 2011-2021
- Premium Statistic Export value of Chinese food products to South Africa 2011-2021
- Premium Statistic Refined aluminum production in South Africa 2010-2021
Selected statistics
10
- Basic Statistic Supply and consumption of gasoline in the Northeast: outlook 2013
- Premium Statistic Oil consumption in Canada 1990-2022
- Premium Statistic Oil production in Venezuela 2008-2022
- Premium Statistic Oil production in Libya 1998-2022
- Premium Statistic OPEC's crude oil production 1998-2022
- Premium Statistic Oil exports from the U.S. 1998-2022
- Premium Statistic Global oil production share 2022, by country
- Premium Statistic Oil consumption in Japan 1990-2022
- Premium Statistic Proved crude oil reserves in the U.S. 1990-2020
- Premium Statistic Latin America: crude oil reserves 1990-2020
Other regions
10
- Premium Statistic Activities for petroleum and natural gas extraction revenue in Italy 2012-2022
- Basic Statistic BRIICS country's energy consumption by source 2015
- Basic Statistic Average monthly premium unleaded petrol prices in Luxembourg 2016-2019
- Premium Statistic Kerosene production in Kuwait 2005-2020
- Premium Statistic Gross electricity generation share in the European Union 1990-2020, by fuel
- Premium Statistic Latin America: price of household LPG 2020, by country
- Basic Statistic Average monthly premium unleaded petrol prices in Cyprus 2016-2021
- Basic Statistic Average monthly premium unleaded petrol prices in Malta 2016-2021
- Basic Statistic Average monthly premium unleaded petrol prices in the Netherlands 2016-2021
- Basic Statistic Average monthly premium unleaded petrol prices in Portugal 2016-2021
Related statistics
10
- Premium Statistic Forecast: revenue motor vehicle manufacture South Africa 2010-2020
- Premium Statistic Forecast: revenue hospitals South Africa 2010-2020
- Premium Statistic Forecast: revenue sporting activities South Africa 2010-2020
- Premium Statistic Forecast: revenue medical and dental practices South Africa 2010-2020
- Premium Statistic Forecast: revenue plastic product manufacture South Africa 2010-2020
- Premium Statistic Forecast: revenue road freight transport South Africa 2010-2020
- Premium Statistic Forecast: revenue real estate agencies South Africa 2010-2020
- Basic Statistic Forecast: revenue construction machinery rent and lease Germany 2009-2020
- Premium Statistic Forecast: revenue private security services Turkey 2009-2020
- Basic Statistic Forecast: revenue agricultural machinery rent and lease Germany 2009-2020
Further related statistics
10
- Thermal coal prices 2013-2022
- Foreign direct investment projects in African countries between 2003 and 2012
- Coal consumption in South Africa 1998-2022
- Agnico-Eagle Mines' average gold price realized 2010-2023
- Agnico-Eagle Mines' gold reserves 2000-2023
- Glencore's net income 2010-2023
- Glencore's sales of energy products 2010-2023
- Rio Tinto's uranium production 2010-2023
- Rio Tinto's diamond production 2010-2023
- Rio Tinto's aluminum and copper production 2010-2023
Further Content: You might find this interesting as well
Statistics
- Thermal coal prices 2013-2022
- Foreign direct investment projects in African countries between 2003 and 2012
- Coal consumption in South Africa 1998-2022
- Agnico-Eagle Mines' average gold price realized 2010-2023
- Agnico-Eagle Mines' gold reserves 2000-2023
- Glencore's net income 2010-2023
- Glencore's sales of energy products 2010-2023
- Rio Tinto's uranium production 2010-2023
- Rio Tinto's diamond production 2010-2023
- Rio Tinto's aluminum and copper production 2010-2023
Statista. (October 14, 2014). Revenue of oil and gas extraction support activities (SIC 09.10) in South Africa from 2008 to 2018 (in million U.S. dollars) [Graph]. In Statista. Retrieved May 19, 2024, from https://www.statista.com/forecasts/338470/south-africa-oil-and-gas-extraction-support-activities-revenue-forecast-sic-0910
Statista. "Revenue of oil and gas extraction support activities (SIC 09.10) in South Africa from 2008 to 2018 (in million U.S. dollars)." Chart. October 14, 2014. Statista. Accessed May 19, 2024. https://www.statista.com/forecasts/338470/south-africa-oil-and-gas-extraction-support-activities-revenue-forecast-sic-0910
Statista. (2014). Revenue of oil and gas extraction support activities (SIC 09.10) in South Africa from 2008 to 2018 (in million U.S. dollars). Statista. Statista Inc.. Accessed: May 19, 2024. https://www.statista.com/forecasts/338470/south-africa-oil-and-gas-extraction-support-activities-revenue-forecast-sic-0910
Statista. "Revenue of Oil and Gas Extraction Support Activities (Sic 09.10) in South Africa from 2008 to 2018 (in Million U.S. Dollars)." Statista, Statista Inc., 14 Oct 2014, https://www.statista.com/forecasts/338470/south-africa-oil-and-gas-extraction-support-activities-revenue-forecast-sic-0910
Statista, Revenue of oil and gas extraction support activities (SIC 09.10) in South Africa from 2008 to 2018 (in million U.S. dollars) Statista, https://www.statista.com/forecasts/338470/south-africa-oil-and-gas-extraction-support-activities-revenue-forecast-sic-0910 (last visited May 19, 2024)
Revenue of oil and gas extraction support activities (SIC 09.10) in South Africa from 2008 to 2018 (in million U.S. dollars) [Graph], Statista, October 14, 2014. [Online]. Available: https://www.statista.com/forecasts/338470/south-africa-oil-and-gas-extraction-support-activities-revenue-forecast-sic-0910