
Erick Burgueño Salas
Research expert covering climate change and the water industry

Detailed statistics
Annual temperature anomalies (°F) in the U.S. 1895-2022

Detailed statistics
Total gross greenhouse gas emissions in the U.S. 1990-2022
Detailed statistics
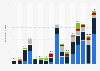
Economic losses due to natural disasters in the U.S. 2009-2023

Global land and ocean temperature anomalies 1880-2023
Annual anomalies in global land and ocean surface temperature from 1880 to 2023, based on temperature departure (in degrees Celsius)

Greenhouse gas emissions worldwide 2022, by country
Largest contributors to greenhouse gas emissions worldwide in 2022, by country (in billion metric tons of carbon dioxide equivalent)

Climate change performance index of G20 2024, by country
Climate change performance index of each of the members of the Group of 20 (G20) forum as of 2024, by category

Carbon budget overshoot compensation owed by largest carbon emitters 2050
Estimated compensation owed by the largest carbon-overshooting countries worldwide from 2020 to 2050, based on a net-zero scenario (in U.S. dollars per capita)

Public opinion on climate change worldwide 2022, by country
Share of people who think that climate change is a threat in selected countries in 2022

Climate Extremes Index in the United States 2022, by region
Climate Extremes Index in the United States in 2022, by region
Total gross greenhouse gas emissions in the U.S. 1990-2022
Annual total gross greenhouse gas emissions in the United States from 1990 to 2022 (in million metric tons of CO₂ equivalent)

Greenhouse gas emissions in the U.S. 1990-2022, by inventory sector
Greenhouse gas emissions in the United States from 1990 to 2022, by inventory sector (in million metric tons of CO₂ equivalent)

Breakdown of greenhouse gas emissions in the U.S. 2022, by gas
Distribution of total gross greenhouse gas emissions in the United States in 2022, by type of gas

Carbon dioxide emissions in the United States 1975-2023
Carbon dioxide emissions from energy consumption in the United States from 1975 to 2023 (in million metric tons of carbon dioxide)

Methane emissions in the United States 1990-2022
Methane (CH4) emissions in the United States from 1990 to 2022 (in million metric tons of carbon dioxide equivalent)

Nitrogen oxides emissions in the U.S. 1970-2023
Annual nitrogen oxides (NOx) emissions in the United States from 1970 to 2023 (in 1,000 tons)

Average annual temperature in the United States 1895-2023
Average annual temperature in the United States from 1895 to 2023 (in degrees Fahrenheit)
Annual temperature anomalies (°F) in the U.S. 1895-2022
Annual temperature anomalies in the United States from 1895 to 2022 (in Fahrenheit)

Number of natural disasters in U.S. 2022, by type
Number of natural disasters in the United States in 2022, by type

Fatalities due to natural disasters in the U.S. 2022
Number of fatalities due to natural disasters in the United States in 2022, by type
Economic losses due to natural disasters in the U.S. 2009-2023
Estimated overall losses due to natural disasters in the United States from 2009 to 2023, by type (in billion U.S. dollars)

Cost of major climate disasters in the United States 1980-2023, by time period
Cost of billion-dollar natural disaster events in the United States from 1980 to 2023, by time period (in billion U.S. dollars)

Average annual percent area affected by drought in the U.S. 2015-2023, by category
Average annual share of area affected by drought in the United States from 2015 to 2023, by category

Sea level rise rate in the U.S. 2022, by selected cities
Rate of sea level rise in the United States in 2022, by selected cities (in millimeters per year)

Renewable energy production in the U.S. 2005-2023, by source
Net generation of renewable electricity in the United States from 2005 to 2023, by source (in terawatt hours)

U.S. clean energy investments 2004-2022
Investment in clean energy in the U.S. from 2004 to 2022 (in billion U.S. dollars)

Plug-in electric light vehicle sales in the U.S. 2016-2022
Estimated plug-in electric light vehicle sales in the United States from 2016 to 2022 (in 1,000 units)

Value of green bonds issued in the U.S. 2014-2022
Value of green bonds issued in the United States from 2014 to 2022 (in billion U.S. dollars)

Federal funding for RD&D for carbon removal technologies in the U.S. 2009-2022
Federal funding for research, development, and demonstration for carbon removal technologies in the United States from 2009 to 2022 (in million U.S. dollars)

Projected mean sea level rise in the U.S. 2020-2150, by scenario
Projected mean sea level rise in the United States relative to 2000 baseline from 2020 to 2150, by scenario (in meters)

U.S. cities - temperature change in summer and winter 2000-2050
Projected change of temperature in selected cities in the United States in summer and winter by 2050 compared to 2000 (in degrees Fahrenheit)

GHG emission projections in the U.S. 2021-2050, by sector
Projected greenhouse gas emissions in the United States under a "business-as-usual" scenario from 2021 to 2050, by sector (in million tons of carbon dioxide equivalent)

Carbon dioxide emissions per person in the U.S. 2022-2050
U.S. carbon dioxide emissions per capita from 2022 to 2050 (in metric tons of carbon dioxide equivalent)

Renewable electricity capacity and generation in the U.S. 2022-2050
Electric power sector renewable capacity and generation in the United States in 2022, with forecast until 2050

IRA's clean energy and climate spending in the United States 2022-2031, by sector
Estimated clean energy and climate funding in the Inflation Reduction Act in the United States from 2022 to 2031, by category (in million U.S. dollars)


Mon - Fri, 9am - 6pm (EST)
Mon - Fri, 9am - 5pm (SGT)
Mon - Fri, 10:00am - 6:00pm (JST)
Mon - Fri, 9:30am - 5pm (GMT)
Mon - Fri, 9am - 6pm (EST)


