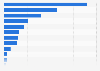
In 2021, the aquaculture production in China was the highest in the Asia-Pacific region with nearly 73 million metric tons. In comparison, the aquaculture production in Bhutan was approximately 193 metric tons in 2021.
Aquaculture production in the Asia-Pacific region in 2021, by country or territory (in 1,000 metric tons)
Basic Account
Get to know the platform
You only have access to basic statistics.
This statistic is not included in your account.
Starter Account
The ideal entry-level account for individual users
- Instant access to 1m statistics
- Download in XLS, PDF & PNG format
- Detailed references
$199 USD / Month *
Professional Account
Full access
Business Solutions including all features.
* Prices do not include sales tax.
Other statistics that may interest you Statistics on
About the industry
9
- Premium Statistic Import volume of fresh lobster South Korea 2014-2022
- Premium Statistic Mexico: fish and seafood production volume 2015-2022
- Premium Statistic Breakdown of the landings populations fished in France in 2021, by ecological status
- Premium Statistic Production volume of crawfish in Sweden 2007-2018
- Premium Statistic Leading surimi import countries to South Korea 2018
- Premium Statistic Peru: export value of Marinazul S.A. 2016-2017
- Premium Statistic Peru: export value of PATSAC 2016-2017
- Premium Statistic Canned tuna importer share worldwide 2015, based on volume
- Premium Statistic Monthly exports of fishery products from China 2023-2024
About the region
10
- Premium Statistic Value of U.S. fresh and frozen fish exports to Asia 2005-2022
- Basic Statistic Value of U.S. fresh and frozen fish imports from Asia 2005-2022
- Premium Statistic Fertilizer consumption volume APAC 2021, by country
- Basic Statistic Most followed Instagram accounts APAC 2023
- Premium Statistic Annual average air pollution level of PM2.5 in megacities APAC 2022
- Premium Statistic Passenger car sales volume APAC 2023, by country
- Premium Statistic Passenger car sales volume APAC 2014-2023
- Premium Statistic Available military personnel APAC 2023, by country
- Premium Statistic Active military personnel APAC 2023, by country
- Premium Statistic Helicopter strength APAC 2023, by country
Selected statistics
4
- Premium Statistic Utilization of the worldwide fish production 2006-2020, by purpose
- Premium Statistic Number of people working in fishing and aquaculture worldwide 1995-2020
- Basic Statistic Global inland capture fisheries production by region 2010
- Premium Statistic Aquaculture production in the Americas by country 2010
Other regions
10
- Basic Statistic Value of U.S. fresh and frozen fish exports to Europe 2005-2022
- Premium Statistic Value of U.S. fresh and frozen fish exports to Africa 2005-2022
- Premium Statistic Brazil: shrimp production volume 2013-2021
- Premium Statistic Distribution of markets of Grieg Seafood 2021, by region
- Premium Statistic Value of U.S. fresh and frozen fish imports from Europe 2005-2022
- Premium Statistic Wages of male agricultural workers in Turkey 2023, by province
- Premium Statistic Growth rate of agriculture sector APAC 2020, by country
- Premium Statistic Profit of Royal Greenland 2009/10-2022
- Premium Statistic Chile: salmon & trout exports value 2022, by destination
- Premium Statistic Peru: export value of fish & fishery products 2014-2019
Related statistics
10
- Premium Statistic Share of agricultural land APAC 2021, by country
- Premium Statistic Retail value fish oil and omega fatty acids supplements APAC 2014, by region
- Premium Statistic Arable land APAC 2021, by country or region
- Premium Statistic M&A activity value in fintech APAC 2017-2023
- Premium Statistic Number of M&A deals in fintech APAC 2017-2023
- Premium Statistic Export value of processed cheese APAC 2022, by country
- Premium Statistic Export value of honey APAC 2022, by country
- Premium Statistic Export value of apricots APAC 2022, by country
- Premium Statistic Export value of cider APAC 2021, by country
- Premium Statistic Export value of ice cream APAC 2022, by country
Further related statistics
10
- Net sales of AGCO 2010-2023
- U.S. total apple production 2000-2023
- BayWa's revenue by segment 2010-2022
- Total U.S. domestic grain use 2001-2023
- CF Industries' revenue 2010-2022
- Area of organic farming worldwide 2000-2022
- Total U.S. wheat area planted and harvested 2001-2023
- Area of corn for grain harvested in the U.S. 2001-2023
- Corn for grain production in the U.S. 2001-2023
- Cotton yield per harvested acre in the U.S. 2001-2023
Further Content: You might find this interesting as well
Statistics
- Net sales of AGCO 2010-2023
- U.S. total apple production 2000-2023
- BayWa's revenue by segment 2010-2022
- Total U.S. domestic grain use 2001-2023
- CF Industries' revenue 2010-2022
- Area of organic farming worldwide 2000-2022
- Total U.S. wheat area planted and harvested 2001-2023
- Area of corn for grain harvested in the U.S. 2001-2023
- Corn for grain production in the U.S. 2001-2023
- Cotton yield per harvested acre in the U.S. 2001-2023
World Bank. (September 19, 2023). Aquaculture production in the Asia-Pacific region in 2021, by country or territory (in 1,000 metric tons) [Graph]. In Statista. Retrieved June 10, 2024, from https://www.statista.com/statistics/633165/asia-pacific-aquaculture-production-by-country/
World Bank. "Aquaculture production in the Asia-Pacific region in 2021, by country or territory (in 1,000 metric tons)." Chart. September 19, 2023. Statista. Accessed June 10, 2024. https://www.statista.com/statistics/633165/asia-pacific-aquaculture-production-by-country/
World Bank. (2023). Aquaculture production in the Asia-Pacific region in 2021, by country or territory (in 1,000 metric tons). Statista. Statista Inc.. Accessed: June 10, 2024. https://www.statista.com/statistics/633165/asia-pacific-aquaculture-production-by-country/
World Bank. "Aquaculture Production in The Asia-pacific Region in 2021, by Country or Territory (in 1,000 Metric Tons)." Statista, Statista Inc., 19 Sep 2023, https://www.statista.com/statistics/633165/asia-pacific-aquaculture-production-by-country/
World Bank, Aquaculture production in the Asia-Pacific region in 2021, by country or territory (in 1,000 metric tons) Statista, https://www.statista.com/statistics/633165/asia-pacific-aquaculture-production-by-country/ (last visited June 10, 2024)
Aquaculture production in the Asia-Pacific region in 2021, by country or territory (in 1,000 metric tons) [Graph], World Bank, September 19, 2023. [Online]. Available: https://www.statista.com/statistics/633165/asia-pacific-aquaculture-production-by-country/