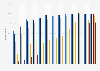
In 2023, approximately 56 percent of e-commerce retail sales in the United Kingdom were conducted through mobile devices. Projections for 2027 anticipate a further rise, with mobile commerce (m-commerce) expected to account for about 57.6 percent of the total online shopping market in the UK.
Mobile as percentage of total retail e-commerce sales in the United Kingdom (UK) from 2019 to 2027
Basic Account
Get to know the platform
You only have access to basic statistics.
This statistic is not included in your account.
Starter Account
The ideal entry-level account for individual users
- Instant access to 1m statistics
- Download in XLS, PDF & PNG format
- Detailed references
$199 USD / Month *
Professional Account
Full access
Business Solutions including all features.
* Prices do not include sales tax.
Other statistics that may interest you Statistics on
About the industry
9
- Premium Statistic Retail m-commerce growth in the U.S. 2019-2027
- Premium Statistic M-commerce retail sales in the U.S. 2019-2027
- Premium Statistic U.S. e-commerce annual sales growth 2022, by product category
- Premium Statistic Cart abandonment rate in Canada 2023, by device
- Premium Statistic Groupon: annual revenue in North America 2009-2022
- Basic Statistic E-commerce user penetration in Belgium 2010-2023
- Premium Statistic Average online shopping order value 2022, by region and device
- Premium Statistic M-commerce share of total retail online sales worldwide 2022, by region
- Premium Statistic E-commerce sales in Mexico 2021-2025
About the region
10
- Premium Statistic Main in-store mobile shopping activities in the UK 2023
- Basic Statistic Device preference for internet browsing in the United Kingdom (UK) 2015, by age
- Basic Statistic Use of smartphones by shoppers in retail stores in the United Kingdom in 2015
- Premium Statistic Penetration rate of e-commerce in the UK 2020-2029
- Basic Statistic Tablet PC usage to go online in the United Kingdom (UK) 2023, by gender
- Premium Statistic UK: digital population January 2024
- Basic Statistic Devices used to access the internet in the United Kingdom (UK) in from 2020
- Basic Statistic Device preference for internet browsing in the United Kingdom (UK) 2018
- Premium Statistic Number of tablet users in the UK 2020-2029
- Premium Statistic UK: leading weekly e-commerce activities 2023, by category
Selected statistics
1
Other regions
10
- Premium Statistic Devices used by digital buyers to purchase goods online Australia 2022
- Premium Statistic U.S. online shopper conversion rate 2021-2022, by device
- Premium Statistic Share of mobile commerce buyers in Spain 2014-2022
- Premium Statistic Share of individuals who had shopped via mobile device in Belgium 2020, by language
- Premium Statistic Devices used to shop online in Denmark 2023
- Premium Statistic Distribution of visits to top cosmetics e-commerce websites in Italy 2019, by device
- Premium Statistic Number of Taobao mobile login users 2010-2012
- Premium Statistic Digital wallet penetration APAC 2013-2015 by country or region
- Premium Statistic Smartphone or tablet usage for mobile shopping in Germany 2011-2016
- Premium Statistic Accessing the internet "on the go" in Great Britain in 2019, by demographic
Related statistics
10
- Premium Statistic Online shopping frequency in Belgium 2011-2020
- Basic Statistic Amazon quarterly net income 2009-2024
- Premium Statistic Cart abandonment rate in the United States 2024
- Basic Statistic E-commerce share of B2B and B2C shipments, sales and revenues in the U.S. 2019-2021
- Premium Statistic Annual net revenue of Intershop Communications 1996-2023
- Basic Statistic Intershop Communications revenue 2020-2023, by region
- Basic Statistic Annual EBITDA of Intershop Communications 2006-2023
- Premium Statistic Online shopper penetration rate in Bulgaria 2004-2020, by gender
- Premium Statistic Online shopper penetration rate in Bulgaria 2004-2020, by region
- Premium Statistic Share of mobile e-commerce turnover on total e-commerce in Italy 2014-2020
Further related statistics
10
- Internet usage on a mobile phone in Great Britain 2010-2019, by age
- Use of smartphones by shoppers in retail stores in Italy in 2015
- Device usage among children to consume media in the United Kingdom (UK) 2013-2019
- Forecast: global data center IP traffic 2013-2021, by segment
- Use of mobile devices to make restaurant reservations in the U.S. 2014, by age group
- Leading trends in technology in restaurants in the U.S. 2015*
- Survey: ownership of mobile devices by U.S. American adults 2011-2012
- Paid ad methods used for B2C content marketing North America 2022
- Leading online retailers in Southeast Asia 2020, by monthly visits
- Change in B2C content marketing budgets North America 2020
Further Content: You might find this interesting as well
Statistics
- Internet usage on a mobile phone in Great Britain 2010-2019, by age
- Use of smartphones by shoppers in retail stores in Italy in 2015
- Device usage among children to consume media in the United Kingdom (UK) 2013-2019
- Forecast: global data center IP traffic 2013-2021, by segment
- Use of mobile devices to make restaurant reservations in the U.S. 2014, by age group
- Leading trends in technology in restaurants in the U.S. 2015*
- Survey: ownership of mobile devices by U.S. American adults 2011-2012
- Paid ad methods used for B2C content marketing North America 2022
- Leading online retailers in Southeast Asia 2020, by monthly visits
- Change in B2C content marketing budgets North America 2020
eMarketer. (December 22, 2023). Mobile as percentage of total retail e-commerce sales in the United Kingdom (UK) from 2019 to 2027 [Graph]. In Statista. Retrieved June 10, 2024, from https://www.statista.com/statistics/260967/uk-mobile-retail-commerce-sales-as-percentage-of-e-commerce-sales/
eMarketer. "Mobile as percentage of total retail e-commerce sales in the United Kingdom (UK) from 2019 to 2027." Chart. December 22, 2023. Statista. Accessed June 10, 2024. https://www.statista.com/statistics/260967/uk-mobile-retail-commerce-sales-as-percentage-of-e-commerce-sales/
eMarketer. (2023). Mobile as percentage of total retail e-commerce sales in the United Kingdom (UK) from 2019 to 2027. Statista. Statista Inc.. Accessed: June 10, 2024. https://www.statista.com/statistics/260967/uk-mobile-retail-commerce-sales-as-percentage-of-e-commerce-sales/
eMarketer. "Mobile as Percentage of Total Retail E-commerce Sales in The United Kingdom (Uk) from 2019 to 2027." Statista, Statista Inc., 22 Dec 2023, https://www.statista.com/statistics/260967/uk-mobile-retail-commerce-sales-as-percentage-of-e-commerce-sales/
eMarketer, Mobile as percentage of total retail e-commerce sales in the United Kingdom (UK) from 2019 to 2027 Statista, https://www.statista.com/statistics/260967/uk-mobile-retail-commerce-sales-as-percentage-of-e-commerce-sales/ (last visited June 10, 2024)
Mobile as percentage of total retail e-commerce sales in the United Kingdom (UK) from 2019 to 2027 [Graph], eMarketer, December 22, 2023. [Online]. Available: https://www.statista.com/statistics/260967/uk-mobile-retail-commerce-sales-as-percentage-of-e-commerce-sales/